
Defence data underpins new underwater map

Defence’s Australian Hydrographic Office (AHO) is a key data contributor to the newly launched Australian Bathymetry and Topography Grid, which maps Australia’s underwater landscape.
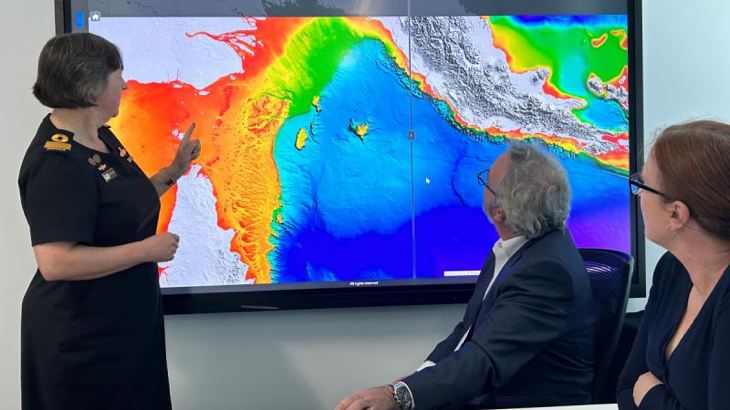
CAPTION: Hydrographer of Australia Commodore Robyn Phillips, Australian Hydrographic Office (AHO) Director Maritime Data Management Doug White and AHO Director Maritime Relationships and Governance Nat McLean use the Australian Bathymetric and Topography Grid. Story by Elizabeth de Bol.
This new map is the result of a collaborative partnership between Geoscience Australia, the Australian Hydrographic Office, James Cook University and the University of Sydney.
Bathymetry is the study and mapping of the sea floor. A task on this scale needed collaboration between all stakeholders who measure the sea and land, as no agency could do it alone.
Project lead and Research Fellow at James Cook University Dr Robin Beaman said the new map is an important development.

“The value lies in seeing the whole three-dimensional picture of Australia’s underwater landscape, giving full geographic context to how the landscape fits together at a national scale, from land to coast, across the continental shelf and into the surrounding deep basins,” said Dr Beaman.
The Australian Bathymetry and Topography Grid is a single map product with a spatial resolution of 250m, made from many bathymetric datasets, to meet government and scientific needs.
The new grid is the first update since 2009 and incorporates data from 1582 individual marine surveys, representing decades of bathymetry data acquisition from the Australian seabed mapping community.
“The AHO’s collaboration in the project and the provision of high-quality bathymetric survey data were critical to the accuracy and development of this new three-dimensional model of Australia’s underwater landscape,” Dr Beaman said.
This included depth data from the latest charts, 30m gridded data from the HydroScheme Industry Partnership Program (HIPP) and historic surveys.
Depth data from the AHO’s suite of electronic navigation charts (AusENC) anchored the data from other contributors’ surveys.
All the surveys were then knitted together into the grid so that it accurately represents the shape of the sea floor.
This assists by resolving height errors in the coastal zone, where the sea meets the land and surveying methods change.
Hydrographer of Australia Commodore Robyn Phillips said the map has many uses.
“An accurate, national-scale grid is useful for a wide range of purposes, from planning off-shore developments, to ecology and regional oceanographic modelling,” said Commodore Phillips.
“The AHO collects the highest quality bathymetric data to produce navigational charts for shipping, and this grid project is an opportunity for the AHO to reuse that data for broad benefit of Australians.”
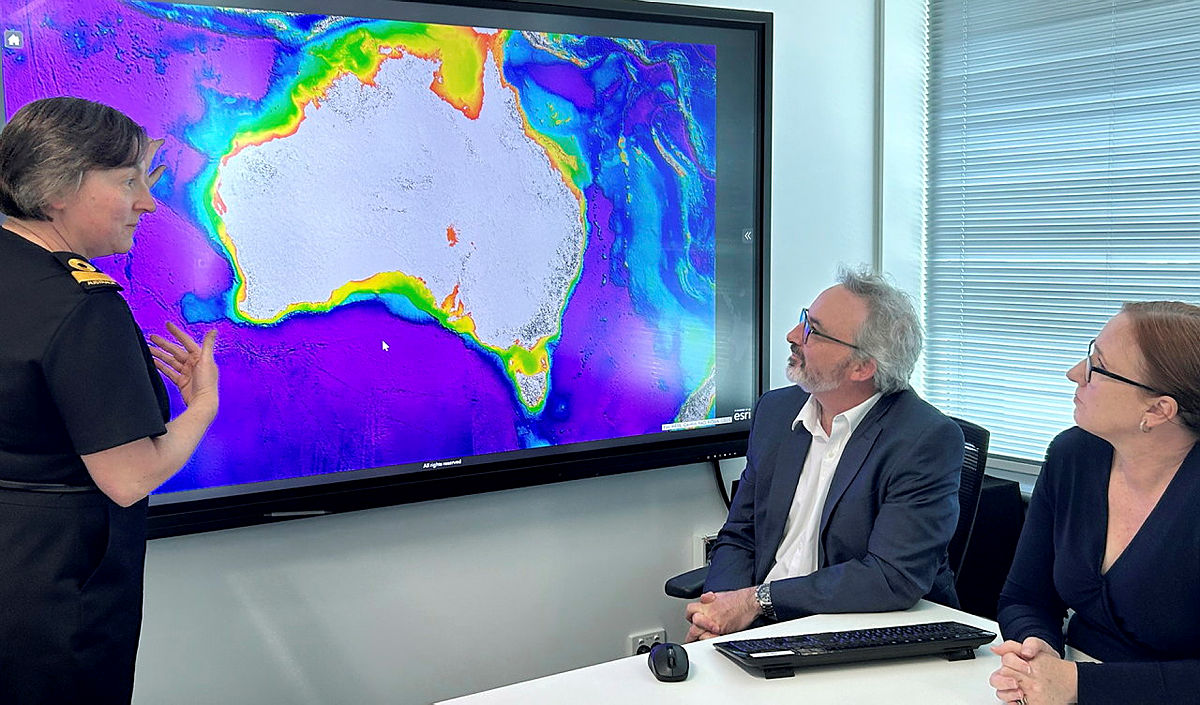
CAPTION: Members view the newly launched Australian Bathymetric and Topography Grid.
.
.

.
.